New Old Memory Task Data Analysis
New_Old (yes/no) Memory task
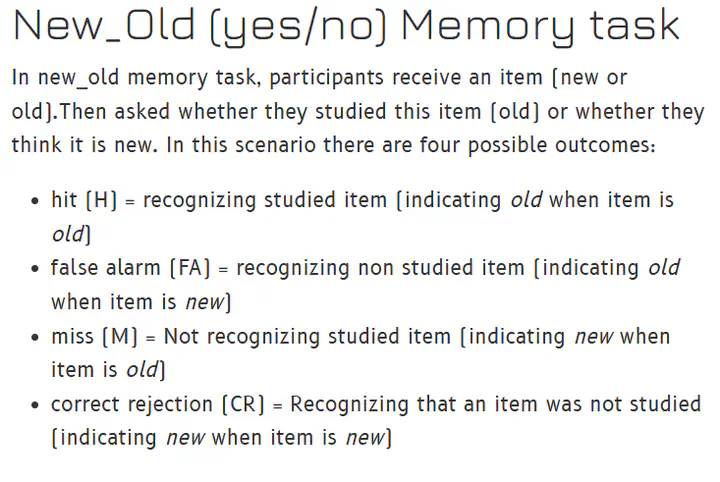
In new_old memory task, participants receive an item (new or old).Then asked whether they studied this item (old) or whether they think it is new. In this scenario there are four possible outcomes:
- hit (H) = recognizing studied item (indicating old when item is old)
- false alarm (FA) = recognizing non studied item (indicating old when item is new)
- miss (M) = Not recognizing studied item (indicating new when item is old)
- correct rejection (CR) = Recognizing that an item was not studied (indicating new when item is new)
Let’s create a dataset.
- Let’s take a study with 30 old and 30 new items (60 in total)
set.seed(2794)
participants <- seq(1,100,1) # This creates a column with 100 participants
hit   <- c(round(c(rnorm(100,20,2.5))))#  this creates a random number of hits that are normally distributed with a mean of 20 and standard deviation of 2.5
fa    <- c(round(c(rnorm(100,7.5,2.5))))#  this creates a random number of hits that are normally distributed with a mean of 7.5 and standard deviation of 2.5
miss  <- 30-hit
cr    <- 30-fa
df <- data.frame(participants,hit,fa,miss,cr)
head(df)
  participants hit fa miss cr
1            1  23  7    7 23
2            2  18  6   12 24
3            3  21  8    9 22
4            4  21  2    9 28
5            5  19  7   11 23
6            6  17  5   13 25
Analyzable Statistics
- I will show the common statistics that can be calculated based on this type of dataset.
hit rate / True Positive Rate
- Rate of choosing the old when old items are presented
- In other fields also called called sensitivity, but we use sensitivity for d'
\begin{align*} hit \ rate = \frac{H}{H + M}\ \end{align*}
Click here for source of formula
df$hit_rate <- df$hit/(df$hit+df$miss)

cat(paste("The hit rate is",format(round(mean(df$hit_rate),2)))) # The function mean turns the hit rate into the mean for the group
The hit rate is 0.65
Overall Percent Correct
- Percentage of hits and correct rejections together
\begin{align*} Overall \ Percent \ Correct = \frac{H + CR}{H + M + FA + CR}\ \end{align*}
Click here for source of formula
df$per_corr = (df$hit+df$cr)/(df$hit+df$fa+df$miss+df$cr)*100
cat(paste("The overall percentage correct is",format(round(mean(df$per_corr),2))))
The overall percentage correct is 70.28
false alarm rate / False Positive Rate
- Rate of choosing the old when new items are presented
\begin{align*} False \ alarm \ rate = \frac{FA}{FA + CR}\ \end{align*} Click here for source of formula
df$FA_rate <- df$fa/(df$cr+df$fa) # this will give the FA rate for each participant
cat(paste("The false alarm rate is",format(round(mean(df$FA_rate),2))))
The false alarm rate is 0.24
Specificity
- rate of choosing new when new items are presented
\begin{align*} Specificity = \frac{CR}{CR + FA}\ \end{align*} Click here for source of formula
df$spec <- df$cr/(df$fa+df$cr) # this will give the FA rate for each participant
# or 1 - fa_rate
cat(paste("The false alarm rate is",format(round(mean(df$spec),2))))
The false alarm rate is 0.76
sensitivity (d’)
- Ability to discriminate between the signal and noise
\begin{align*} Sensitivity = Z(H) - Z(FA)\ \end{align*} Click here for source of formula
df$sens = qnorm(df$hit_rate) - qnorm(df$FA_rate)
cat(paste("The sensitivity d' is",format(round(mean(df$sens,2)))))
The sensitivity d' is 1
Response Bias (c)
- Individual’s tendency to favor one response alternative over the other
\begin{align*} Response \ Bias = -\frac{Z(hit \ rate) + Z(false \ alarm)}{2}\ \end{align*} Click here for source of formula
df$c = -((qnorm(df$hit_rate) + qnorm(df$FA_rate)) / 2)
cat(paste("The response bias c is",format(round(mean(df$c),2))))
The response bias c is 0.17
Diagnositicity ratio
- The ratio of recognizing “old” items as old to recognizing new items as “old”.
\begin{align*} Diagnositicity \ ratio = \frac{hit \ rate}{false \ alarm \ rate}\ \end{align*} Click here for source of formula
df$diag = df$hit_rate/df$FA_rate
cat(paste("The diagnosticity is",format(round(mean(df$diag),2))))
The diagnosticity is 3.35
Positive likelihood ratio (PLR)
- Probability that participants indicate “old” when the item is “old” divided by the probability that participants indicate “old” for “new” items
\begin{align*} Positive \ likelihood \ ratio = \frac{hit \ rate}{1 - false \ alarm \ rate}\ \end{align*} Click here for source of formula
# positive likelihood ratio
df$plr <- df$hit_rate/(1-df$FA_rate)
cat(paste("The PLR is",format(round(mean(df$plr),2))))
The PLR is 0.87
Negative likelihood ratio (NLR)
- The probability of participants indicating “new” when the item is “old” divided by the probability that participants indicate “new” when the items is “new” (specificity)
\begin{align*} Negative \ likelihood \ ratio = \frac{1- hit \ rate}{specificity}\ \end{align*} Click here for source of formula
# Negative likelihood ratio
df$nlr <- (1-df$hit_rate)/df$spec
cat(paste("The NLR is",format(round(mean(df$nlr),2))))
The NLR is 0.47
Positive predictive value (PPV)
- Probability that of correctly indicating “old” out of all “old” responses (hits +false alarms)
\begin{align*} Positive \ predictive \ value = \frac{H}{H + FA}\ \end{align*} Click here for source of formula
# positive likelihood ratio
df$ppv <- df$hit/(df$hit+df$fa) * 100
cat(paste("The PPV is",format(round(mean(df$ppv),2))))
The PPV is 73.23
Negative predictive value (NPV)
- The probability of correctly indicating “new” out of all “new” responses (misses + correct rejections)
\begin{align*} Negative \ predictive \ value = \frac{CR}{CR + M}\ \end{align*} Click here for source of formula
# Negative likelihood ratio
df$nlr <- df$cr/(df$cr+df$miss) * 100
cat(paste("The NPV is",format(round(mean(df$nlr),2))))
## The NPV is 68.54